System administrators need to monitor their server to ensure proper functioning. The practice enables administrators to detect possible issues in advance and recover the system, before it causes any trouble.
There are plenty of commands on Linux to monitor different system resources like cpu usage, memory usage, network, disk usage and so on. Popular ones are top, htop, iostat, nethogs etc.
In this post we are talking about simple command line tools that can monitor multiple system resources like cpu, memory, network, disk, processes etc all together in a real-time and interactive manner. These tools present a whole lot of statistical information on a single screen that is constantly updated.
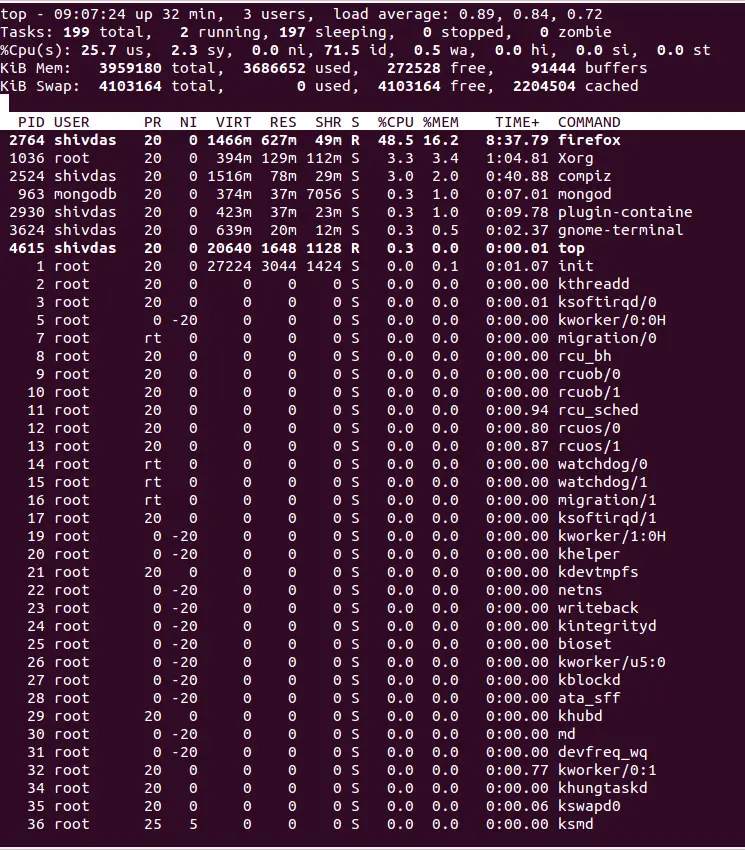
1. Top
The Top command is the most popular tool to check the cpu and memory utilization processwise. It shows a sorted list of processes with the most resource intensive processes on the top.
Along with the process list it also shows cpu and memory usage.

Press ‘h’ while top is running, to display the help page.
2. Htop
This is your all time favourite tool. Similar to top, but much refined and carries a load of extra features along with a very good looking user interface. It is not installed by default, but is available in the default repositories of distros like Ubuntu and Fedora. CentOS users need to use an additional repository like epel or rpmforge to install it.
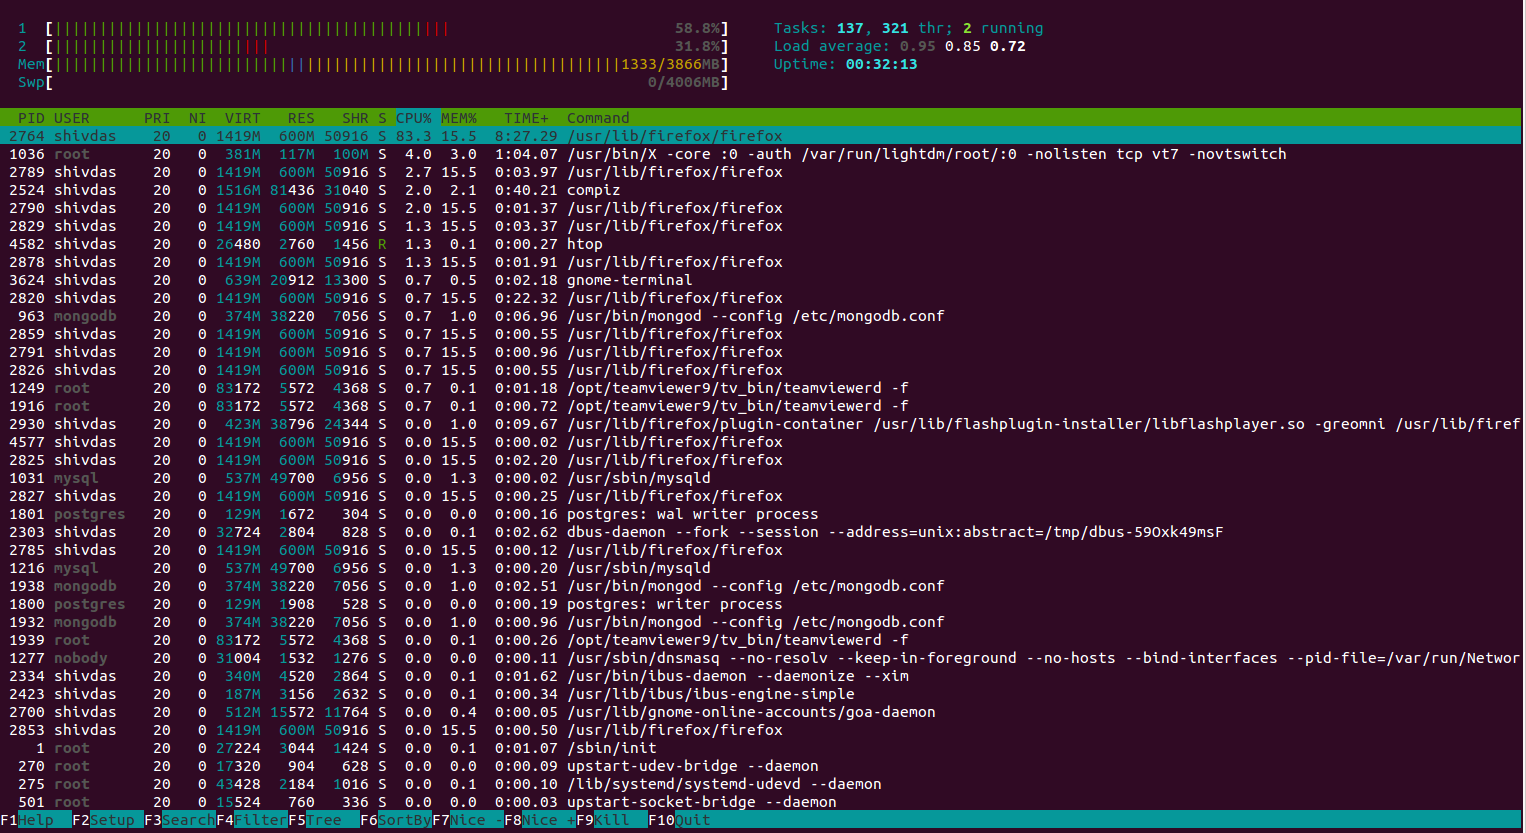
Here are some shortcuts to configure htop output interactively.
M: Sort processes by memory usage
P: Sort processes by processor usage
?: Access help
k: Kill current/tagged process
F2: Setup htop. You can choose display options here.
/: Search processes
Refer to the man page to learn more about htop.
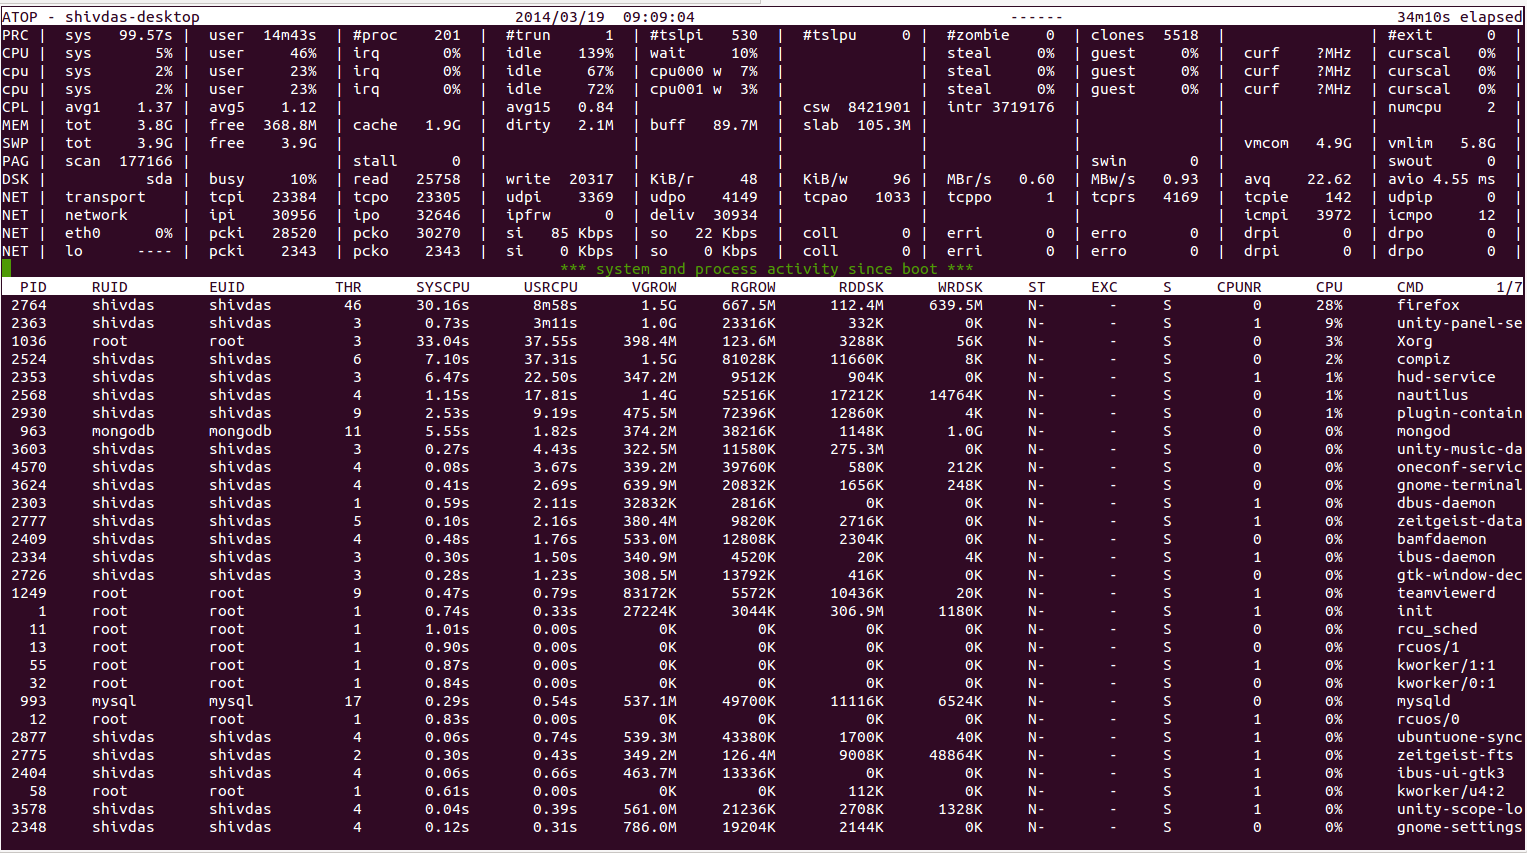
3. Atop
Atop is a tool to monitor system resources and processes. It shows the current usage levels of cpu, memory, disk and network along with a list of processes sorted by cpu usage in descending order. Similar to top and htop.
4. Nmon
Nmon is another very easy to use tool to monitor cpu, memory, networ, disk usage and process list on a single screen. Nmon works well as a reporting only tool but does not have any other feature or option to manage processes or modify the report display. It can save the statistics to a spreadsheet file.
Check out our previous post on Nmon.
5. Glances
Written in python, Glances is a reporting tool similar to Nmon that report statistics on cpu, memory, network, disk and processes. Apart from reporting the statistics, glances does not support any other feature or function.
Check our previous post on how to monitor system resources with Glances.
Press ‘h’ while glances is running to access the help page.
6. Saidar
Saidar is the simplest of all tools. The output includes statistics on CPU, processes, load, memory, swap, network I/O, disk I/O, and file system information. The output does not mention the running processes at all.