TShark is the terminal-based sibling of Wireshark, used to capture and analyze packets directly in the command line. It’s especially helpful for:
- Headless servers and embedded systems
- Automating
.pcapanalysis - Fast text-based filtering, extraction, and scripting
In this guide, we explain every major option in TShark with clear examples, including:
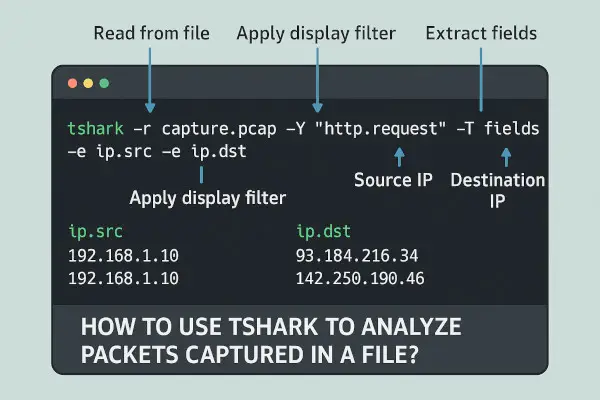
-r: Read from file-V: Verbose output-Y: Display filter-Tand-e: Extract specific fields-z: Generate stats
✅ Step 1: Install TShark on Ubuntu
sudo apt update
sudo apt install tshark -y
After install, verify it:
tshark -v
📘 Step 2: Read a .pcap File Using -r
tshark -r capture.pcap
Option Explained:
-r <filename>tells TShark to read from a previously captured.pcapfile instead of live interface capture.
Output:
It prints one line per packet: timestamp, source, destination, and protocol.
🔍 Step 3: Display Detailed Packet Info with -V
tshark -r capture.pcap -V
Option Explained:
-Vstands for Verbose. It prints each packet in expanded form—showing layer-by-layer dissection like Ethernet, IP, TCP, etc.
Example Output Snippet:
Frame 1: 74 bytes
Ethernet II, Src: IntelCor_5e:14:22, Dst: Broadcast
Internet Protocol Version 4, Src: 192.168.1.10, Dst: 192.168.1.255
User Datagram Protocol, Src Port: 5353, Dst Port: 5353
Data: ...
Use this when you need deep inspection like Wireshark’s middle pane in the terminal.
🎯 Step 4: Filter Packets Using -Y (Display Filter)
tshark -r capture.pcap -Y "http.request"
Option Explained:
-Y <filter>applies a Wireshark-style display filter to only show packets that match a condition.
Examples:
ip.src == 192.168.1.1— Only packets from that IPtcp.port == 443— Only TCP port 443 (HTTPS)dns.qry.name == "google.com"— DNS query to Google
You can combine it with -V:
tshark -r capture.pcap -Y "http.request" -V
📊 Step 5: Extract Specific Fields Using -T fields -e
tshark -r capture.pcap -T fields -e frame.number -e ip.src -e ip.dst -e _ws.col.Protocol
Options Explained:
-T fields: Output as fields (structured text)-e <field>: Print specific field (can be repeated multiple times)
Example Output:
1 192.168.1.10 8.8.8.8 DNS
2 8.8.8.8 192.168.1.10 DNS
Get all available fields with:
tshark -G fields
📝 Step 6: Format Output for CSV or Text Export
tshark -r capture.pcap -T fields -e frame.number -e ip.src -e ip.dst -e frame.len -E header=y -E separator=, > packets.csv
Options Explained:
-E header=y: Adds column names as the first row-E separator=,: Specifies the delimiter (CSV format)
Output looks like:
frame.number,ip.src,ip.dst,frame.len
1,192.168.1.10,8.8.8.8,74
2,8.8.8.8,192.168.1.10,90
📈 Step 7: Use -z for Statistics
tshark -r capture.pcap -z io,phs
Option Explained:
-zenables statistics outputio,phsmeans Protocol Hierarchy Statistics
This gives you a protocol breakdown:
eth                                                 frames:120 bytes:10440
  ip                                                frames:118 bytes:10280
    tcp                                             frames:80  bytes:9000
      http                                          frames:60  bytes:7800
    udp                                             frames:38  bytes:1280
      dns                                           frames:20  bytes:1100
Other useful -z options:
-z conv,tcp— TCP conversation stats-z endpoints,ip— IP endpoints summary-z io,stat,1— Packet rate per second
🔄 Step 8: Combine Filters, Verbose Output, and Extraction
Example: Print only HTTP requests in verbose mode:
tshark -r capture.pcap -Y "http.request" -V
Example: Extract only DNS query names:
tshark -r capture.pcap -Y "dns.qry.name" -T fields -e dns.qry.name
🧪 Use Case: Find All Unique IPs in PCAP
tshark -r capture.pcap -T fields -e ip.src -e ip.dst | sort | uniq
Explanation:
You can pipe the structured output into Unix tools like sort and uniq to analyze unique IP addresses communicating in the capture.
⚠️ Common Mistakes to Avoid
| Mistake | Why It Happens / Fix |
|---|---|
Using -Y without -r | -Y needs a .pcap file, use -r file.pcap |
-V makes too much output | Combine with -c <number> to limit: -c 10 -V |
| Fields show blank | Make sure the field exists in the packet type being filtered |
| JSON output missing fields | Use -T jsonraw or inspect deeply nested structures |
TShark gives you the full analytical power of Wireshark—from the command line. Whether you’re debugging TCP handshakes, filtering HTTP requests, or analyzing DNS queries, TShark is fast, scriptable, and highly versatile.
With options like -r, -V, -Y, -T, and -z, you can turn raw .pcap files into precise, human-readable or machine-readable summaries in seconds.
Have you used TShark for batch analysis or in scripts?
Share your favorite command combos or tricks below—we’d love to see how you use it in real-world workflows!