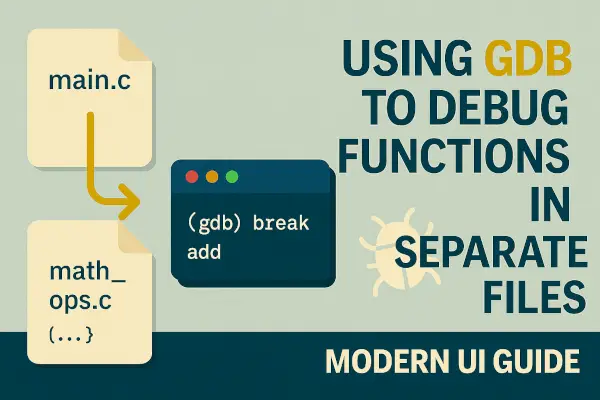
C projects often span across multiple files for better code organization. But debugging across them—especially when a function is defined in another .c file—can be confusing.
GDB (GNU Debugger) is a powerful tool that helps you:
- Set breakpoints in any file
- Step into functions across files
- Watch variables and control program flow
This guide teaches you how to debug C programs with functions split across multiple files using GDB like a pro.
📁 Project Structure Example
Let’s say you have the following files:
main.c
math_ops.c
math_ops.h
📄 math_ops.h
#ifndef MATH_OPS_H
#define MATH_OPS_H

int add(int a, int b);
int subtract(int a, int b);

#endif
📄 math_ops.c
#include "math_ops.h"

int add(int a, int b) {
    return a + b;
}

int subtract(int a, int b) {
    return a - b;
}
📄 main.c
#include <stdio.h>
#include "math_ops.h"

int main() {
    int x = 10, y = 5;
    int result = add(x, y);
    printf("Result: %d\n", result);
    return 0;
}
⚙️ Step 1: Compile with Debug Info
Use the -g flag to include debugging information:
gcc -g main.c math_ops.c -o app
🐞 Step 2: Launch GDB
gdb ./app
🎯 Step 3: Set Breakpoints in Another File
Set a breakpoint in a function defined in math_ops.c:
break math_ops.c:5
Or set it by function name directly:
break add
GDB will break when that function is called—even if it’s not in main.c.
▶️ Step 4: Run the Program in GDB
run
You’ll see the debugger pause at your breakpoint.
🐾 Step 5: Step Through the Code
Navigate the execution:
step     # Step into a function
next     # Step over
finish   # Run until current function returns
print x  # Show value of x
📜 Useful GDB Commands Summary
| Command | Description |
|---|---|
list | Show source code |
break file:line | Set breakpoint in specific file |
info breakpoints | List all breakpoints |
print variable | Show variable value |
backtrace or bt | Show call stack |
quit | Exit GDB |
⚠️ Common Issues and Fixes
| Problem | Solution |
|---|---|
| Breakpoint not hitting | Ensure the correct file and line number |
| Cannot read symbols | Recompile with -g flag |
| Code not stepping into function | Make sure you’re not stepping into an inline or optimized call |
Debugging multi-file C programs with GDB may seem tricky at first—but it’s incredibly powerful. By setting breakpoints in other files, stepping into function calls, and inspecting values, you gain full control of the execution.
Whether you’re working on a simple CLI or a complex system app, GDB is your go-to tool for finding bugs and understanding flow across files.
Are you using GDB for debugging multi-file projects?
Share your tips, tricks, or questions in the comments below! 👇
