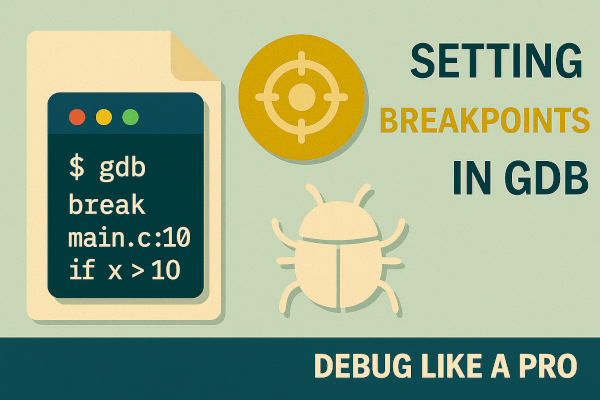
GDB (GNU Debugger) is the go-to tool for debugging C and C++ programs on Linux. One of the most powerful features it offers is the breakpoint—a marker that tells the debugger to pause execution at a specific line or condition.
Breakpoints help you:
- Inspect variables at critical code lines
- Step through logic in real time
- Detect and fix segmentation faults, memory issues, or logic bugs
In this guide, we’ll cover how to:
- Set basic, conditional, and temporary breakpoints
- Break by file, line, or function
- Enable, disable, and delete breakpoints
🛠️ Step 1: Launch Your Program in GDB
Compile your code with debug symbols:
gcc -g main.c -o main
Launch GDB:
gdb ./main
🎯 Types of Breakpoints in GDB
✅ 1. Breakpoint by Line Number
break 15
⏱ Pauses execution at line 15 of the currently loaded file.
✅ 2. Breakpoint in Specific File and Line
break utils.c:42
🎯 Useful for multi-file programs.
✅ 3. Breakpoint by Function Name
break my_function
Breaks at the beginning of the specified function.
✅ 4. Conditional Breakpoint
break my_function if x > 10
⛔️ Only breaks if the condition is true when function is called.
✅ 5. Temporary Breakpoint
tbreak main
💡 This breakpoint will be removed after it’s hit once. Great for entry points or quick checks.
✅ 6. Breakpoint at a Memory Address
break *0x080484c6
Advanced use case: debugging low-level or assembly code.
⚙️ Manage Breakpoints
List All Breakpoints:
info breakpoints
Disable a Breakpoint:
disable 2
Enable Again:
enable 2
Delete a Breakpoint:
delete 2
💡 Replace 2 with your breakpoint number (from info breakpoints).
🔄 Bonus: Breakpoint Commands
You can attach actions to a breakpoint:
break update_score
commands
  print score
  continue
end
📌 This will print score every time update_score() is hit, and continue execution.
Breakpoints are the backbone of efficient debugging in GDB. Whether you’re working on a simple main.c or a multi-module project, mastering different types of breakpoints helps you diagnose issues faster, analyze control flow, and build better programs.
What’s your favorite GDB trick?
Have a breakpoint use case you’d like help with?
Drop your thoughts and questions in the comments below! 🔧🧑💻
